Three Tips for a Smarter City project, IBM's Justin Cook shares insights working on Portland modeling project

I got a chance to talk to IBM's Justin Cook, Program Director, System Dynamics for Smarter Cities about IBM's press release for the Smarter Cities Portland project. 

IBM and City of Portland Collaborate to Build a Smarter City

Portland, Oregon, USA - 09 Aug 2011: To better understand the dynamic behavior of cities, the City of Portland and IBM (NYSE: IBM) have collaborated to develop an interactive model of the relationships that exist among the city's core systems, including the economy, housing, education, public safety, transportation, healthcare/wellness, government services and utilities. The resulting computer simulation allowed Portland's leaders to see how city systems work together, and in turn identify opportunities to become a smarter city. The model was built to support the development of metrics for the Portland Plan, the City's roadmap for the next 25 years.

I've got friends in Portland, so I appreciate the unique environment Portland has.  Here is what IBM discusses as when and why Portland was chose for the Smarter City project.

IBM approached the City of Portland in late 2009, attracted by the City's reputation for pioneering efforts in long-range urban planning. To kick off the project, in April of 2010 IBM facilitated sessions with over 75 Portland-area subject matter experts in a wide variety of fields to learn about system interconnection points in Portland. Later, with help from researchers at Portland State University and systems software company Forio Business Simulations, the City and IBM collected approximately 10 years of historical data from across the city to support the model. The year-long project resulted in a computer model of Portland as an interconnected system that provides planners at the Portland Bureau of Planning and Sustainability with an interactive visual model that allows them to navigate and test changes in the City's systems.

In talking to Justin, I asked him what Tips he had for implementing this complex project.  Here are three tips Justin shared with me.

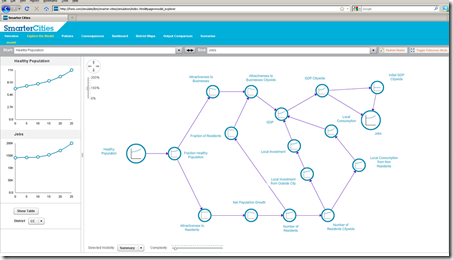
  1. Discuss the relationships of the groups to understand their perspectives and views.  This data will help you understand the semantics of information that helps you build a model.   There were 75 subject matter experts and multiple organizations involved in discussing initiatives for Portland's Plan.  Below is a view of one dashboard showing various metrics that get you thinking beyond an individual department's view.image
  2. Assumptions are openly documented to let others know inputs into the models.  Below is an example of bike lanes.image
  3. Trade-off between transparency and complexity where a simpler approach is easier to understand, therefore appears more transparent.  Justin shared that IBM's system dynamics team had 7,000 questions identified in a smarter city modeling project.

IBM is working with other cities to apply the lessons learned in Portland.

This collaboration with the City of Portland has also proven valuable for IBM.  IBM is applying its experience and modeling capabilities developed in this collaboration with the City of Portland to create offerings that will help other cities leverage systems dynamics modeling capabilities to enhance their city strategic planning efforts. Based upon IBM's experience in working with and conducting assessments of cities around the world, they've found that strategic planning in many cities is still being done in stovepipes without a holistic view of impacts/consequences across systems. By leveraging systems dynamics modeling techniques, IBM will be able to help other cities plan "smarter".

In closing Justin and I discussed the potential for projects that affect multiple city metrics and multiple city organizations to see in the model how ideas like more walking & biking lanes can address obesity, getting people out of cars which then reduces the carbon footprint of the city.  Bet you didn't think that addressing obesity could fit in a carbon reduction strategy.  IBM and Portland see the relationships in this and many other areas.

How valuable is the IBM Smarter City model?  We'll see some of the first results from Portland.
Managing a Sustainable Online Community

A friend posted a line to this post on how to manage a sustainable online community which is one of the greener ways to leverage cloud services in a data center.

And these are good things to think about if you want to get involved in social data center networks.

HOW TO: Manage a Sustainable Online Community

Community Network ImageRob Howard is the CTO/founder of enterprise collaboration software company Telligent.

A 2008 Gartner study on social software noted that “about 70 percent of the community typically fails to coalesce.” While the measurement and the statistics behind this statement raise questions, there is an element of truth.

The popularity of the post is high.

image

I've read the article a few times to think about to leverage the ideas, and completely missed the author's name, Rob Howard.

Rob Howard, Founder and CTO

Rob Howard is the vision behind Telligent's product development and innovation and is known throughout the industry as an authority in community and collaboration software. As Telligent's Founder and Chief Technology Officer, Howard oversees product development and the company's technology roadmap. A true pioneer, Howard contributed to the development and adoption of Microsoft's Web platform technologies, where he helped create and grow the innovative ASP.NET community. In 2004, he continued his vision for customer engagement when he founded Telligent, which was first-to-market with integrated online community software. Howard also understood early on the value of community analytics, and Telligent was first-to-market with an application to address this need.

I worked with Rob at Microsoft and it is great to see he has a successful company focusing on collaboration.  Now that I have a connection with the author I am reading the post with a different perspective.

Rob makes three excellent mistakes in online communities.

There are detrimental effects of over-hyping the technology and then committing the three cardinal sins of running a community:

  • If you build it they will come. This is probably the best known online community fallacy. The premise is that if I roll out a given technology set (blogs, forums, wikis, etc.), users will automatically appear and congregate, forming a robust community. This can be attributed to the lure of “social software” that companies repeatedly bite at, as opposed to seeking to extend or create value for their customers.
  • Once I’ve launched it, I’m done. Many communities launch successfully, only to fade out and disappear. This is due in large part to a failure to assign ownership of the community and to have a strategy that lasts past “launch.”
  • Bigger is better. The assumption here is that the overall size of a community is indicative of its success. This is challenging for most community managers and businesses to understand, as it is contrary to what they’ve usually been told.

And discusses the relationship of the size of a group and benefit to end users.

Community life cycles are often portrayed as simple linear progressions, with the goal of “maintenance” once maturity is reached. However, I have found that a community has unique characteristics that conflict with many of the preconceived notions of success. While the value of the community to its creators increases as membership increases, the value to individual members may diminish. Disregard for, or lack of understanding of these behaviors can lead to the failure of a community.

Analogies have been made to high schools and sub groups that exist.

It should be noted that I am not advocating that communities be limited by membership size. Rather, capabilities should exist within a larger community to support smaller, internal groups that can form around narrow areas of interest. This is validated by both Twitter and FacebookFacebook, which have in recent months both introduced capabilities to narrow the scope of conversations: Lists, privacy controls, and so on.

Read more

World Cup Soccer, assessment of unrest and violence

Today is the start of World Cup Soccer and I was watching this screen, and it reminded of some work done by some really smart people.

Below is the setup for the South Africa first goal.

image

The movement that allows South Africa to get in position.

image 

And the goal

image

It is easy to do a post-analysis on what caused the goal.  But, it is much harder to do a pre-analysis on the factors that affect winning or losing.

Now let me show you what the smart people I know are able to do at the World Cup Soccer to understand the potential dynamics that can cause unrest and violence.  Here is the PDF I will be referring to.

The following is a demo showing the use of Thetus's Savanna product.

image

In the upper left is the assumption, "Demographics and migration patterns may influence stability during the world cup.  Immigration is a primary issue"

image

Which then supports, "What are the potential dynamics that can cause unrest or violence during the World Cup?"

image

How many systems have you seen that accept questions as input?  Almost all other systems are focused on data you have already set up monitoring, looking only within your system.  Can you ask questions that gets you looking for information beyond your data feeds?

You can browse the PDF to see more of the events and relationships.

Thetus Savanna allows an analysis process to see relationships and how events occur.  With this understanding you can mitigate undesirable action and invest in areas that are win conditions.

People actually do this activity all the time, but almost no one has a tool like Thetus Publisher.  (Disclosure: I am working with Thetus to figure out how their technology can be applied to data center scenarios, because they are some of the smartest people I've found to figure out how to model the complexity in the data center.)

There are only a handful of people at this time who can understand this technology and apply it.  And, luckily after two years figuring out who the right people are and what are the right scenarios, this method is closer to being deployed.

Writing this blog entry was the easiest way to tell the less than 10 people i know who will understand this approach "here is a cool graphic you can use to illustrate the potential use to your co-workers and team."

And, it is time to start sharing this approach.  I'll continue to post on this modeling method as it explains how I am using my blog posts.  In general, I am blogging about public facts that fit in modeling data centers.

As a few of my business associates and clients know, there is logic to my posts, and they can read the relationships between the posts.  This does not apply to all posts, but they know how to parse what I write.  One benefit of using this blogging approach is I can meet with people, and we immediately can drop into details as they have been reading what I have been blogging.

As my wife just told me last night, I wish you could tell me how to use technology as well as you write things.  I told her well, I spend more time thinking about what to write, than I do thinking about what to say.  :-)

In the same way it is sometimes hard to understand the exact movements in a soccer match that support a goal, once you recognize the patterns that you want to repeat, you start to score more.

Enjoy the World Cup Soccer. 

Read more

Can Data Centers benefit from Supply Chain Management concepts?

Currently, I am studying data center site selection, and have been asking the question what is wrong with data centers having 1% of the cost being in the land when other commercial real estate will typically have land 20-25% of the cost.  One big thing most miss is land is not a cost, it is a non-depreciable asset. 

Capital assets that are inexhaustible or where the useful life does not diminish or expire over time, such as land and land improvements. Infrastructure assets reported using the modified approach to depreciation are also not depreciated.

Land is not an expense, it is an investment.  So, land should be looked evaluated on its ROI, not it's overall cost, including land improvements. 

Which then led me to think why is it data centers don't use more supply chain management concepts which would address issues like land cost in the overall solution and most likely save you much more than the cost of the land?

Supply Chain Management is defined as.

Supply chain management (SCM) is the management of a network of interconnected businesses involved in the ultimate provision of product and service packages required by end customers (Harland, 1996).[1] Supply Chain Management spans all movement and storage of raw materials, work-in-process inventory, and finished goods from point of origin to point of consumption (supply chain).

Another definition is provided by the APICS Dictionary when it defines SCM as the "design, planning, execution, control, and monitoring of supply chain activities with the objective of creating net value, building a competitive infrastructure, leveraging worldwide logistics, synchronizing supply with demand, and measuring performance globally."

Can't you think of all the different groups and vendors involved in providing data center and IT services as a supply chain management problem?  Is the CIO in charge of the supply chain? Maybe.

Here is a piece of irony from a CIO.com article on supply chain management.  Supply chain management SW is a mess.

Supply chain management software is possibly the most fractured group of software applications on the planet. Each of the five major supply chain steps previously outlined is comprised of dozens of specific tasks, many of which have their own specific software. Some vendors have assembled many of these different chunks of software together under a single roof, but no one has a complete package that is right for every company. For example, most companies need to track demand, supply, manufacturing status, logistics (i.e. where things are in the supply chain), and distribution. They also need to share data with supply chain partners at an ever increasing rate. While products from large ERP vendors like SAP's Advanced Planner and Optimizer (APO) can perform many or all of these tasks, because each industry's supply chain has a unique set of challenges, many companies decide to go with targeted best of breed products instead, even if some integration is an inevitable consequence.

So, if a bunch of people who focus only on supply chain management can't get the software right, how can the data center industry get the right software to run data centers like a supply chain?

I think I have an answer on how to approach supply chain management for data centers.  The first step is to identify the problem, then test what approaches solve the problem best. The fragmentation and silos is the opportunity to address.  How do you pull all the pieces together?  My ideas are based on using social networking and memetics.

More to come.

Read more

Open Data Map movement demonstrates innovation opportunity for Open Sourced Data Center Initiative

Tim Berners- Lee has a 6 minute TED presentation on the year open data went worldwide.

Map and location services are top scenarios for mobile devices.  Google and Microsoft have their maps.  Nokia bought Navteq and MetaCarta.  Apple bought PlaceBase.  With all the companies creating services, volunteers using an open approach to collaborate can beat the proprietary services.

The MercuryNews reports on Open Street Maps.

Volunteers create new digital maps

By Mike Swift

mswift@mercurynews.com

Posted: 04/09/2010 09:08:55 PM PDT

Updated: 04/10/2010 01:36:26 PM PDT

Ron Perez hikes by a waterfall while a portable GPS device records his tracks as... (Jim Gensheimer)

When Brian "Beej" Hall first heard about an audacious volunteer effort to create an Internet map of every street and path in every city and village on the planet, he was hooked. At the time, the nascent effort had only a few American members, and the U.S. map was essentially a digital terra incognita.

Just a few years later, the Berkeley software engineer is editing digital maps so precise they include drinking fountains and benches in the Bay Area parks where he hikes, and the mapping community has swelled to more than 240,000 global members. The effort, OpenStreetMap, is a kind of grass-roots Wikipedia for maps that is transforming how map data is collected, shared and used — from the desktop to smartphones to car navigation.

The reporter makes the observation of how a nonprofit community can change the map business.

But increasingly, the nonprofit community collaboration model behind OpenStreetMap, which shares all the cartographic data in its maps for free, is also changing the business of mapping, just as Wikipedia changed the business of reference. More and more, the accuracy of searches on Google Maps or directions issued by your car's navigational device are based on data collected by volunteers like Hall and other members of OpenStreetMap's do-it-yourself army.

Part of the reason why OpenStreetMap is popular is the fact that the end users are creating the maps.

OpenStreetMap users say that because their data is collected by people who actually live in a place, it is more likely to be accurate.

"It's the people's map," said Paul Jarrett, director of mapping for CloudMade.

If you are interested in the use of OpenStreetMap in Haiti go here.

We chose to tell the story of 'OpenStreetMap - Project Haiti'.
We all followed the crisis that unfolded following the Haiti earthquake, many of us chose to donate money, a few were flown out and deployed as part of the relief effort. But what practical impact can many have without being there in Haiti itself? Well, during this crisis a remarkable story unfolded; of how people around the world could virtually collaborate and contribute to the on-the-ground operations.

OpenStreetMap - Project Haiti 1

With the little existing physical, political and social infrastructure  now destroyed or damaged, the situation was especially challenging for aid agencies arriving on the ground. Where are the areas most in need of assistance, how do we get there, where are people trapped under buildings, which roads are blocked? This information is important to the rescue agencies immediately after the event, and to the longer rebuilding process. In many developing countries, there is a lack of good mapping data and particularly after a crisis, when up-to-date information is critical to managing events as they evolve.
Enter OpenStreetMap, the wiki map of the world, CrisisMappers and an impromptu community of volunteers who collaborated to produce the most authoritative map of Haiti in existence. Within hours of the event people were adding detail to the map, but on January 14th high resolution sattelite imagery of Haiti was made freely available and the Crisis Mapping community were able to trace roads, damaged buildings, and enter camps of displaced people into OpenStreetMap. This is the story of OpenStreetMap - Project Haiti:

There are many who think the Open Source Data Center Initiative will not work.  There are a lot of people who thought OpenStreetMaps wouldn't work too.

Read more